 chmonitor
v0.3 — What's New
What's new in chmonitor v0.3 — TanStack Start framework, Cloud (SaaS) mode, Postgres monitoring beta, pluggable auth, alerting rules, AI insights, MCP server, and dozens of new monitoring views.
v0.3 rebuilds the dashboard on TanStack Start and rolls up everything shipped during the v0.2 cycle: chmonitor Cloud, Postgres monitoring (beta), PeerDB views, a pluggable authentication system, a full alerting rule engine, the AI Insights engine, and dozens of new monitoring views.
Upgrading from v0.2?
For most self-hosters, the only required action is a redeploy. The NEXT_PUBLIC_* → VITE_* rename is optional — old names still work. See Migrate to v0.3 for the full walkthrough.
TanStack Start (new framework)
The dashboard is rewritten on TanStack Start with Vite. Every page is pre-rendered at build time, so the initial shell loads from cache before ClickHouse is contacted. The legacy Next.js app is removed.
- Static prerender for all 75+ dashboard pages (#1392).
- TanStack Query replaces SWR for client-side data fetching (#1562).
- Cloudflare Workers and Docker/Node builds from the same source — no OpenNext layer.
NEXT_PUBLIC_*env vars renamed toVITE_*; old names still work as a fallback.- Static loading skeletons for faster first paint (#1506).
- Query cache persisted to localStorage for instant warm loads (#1505, #1508).
- Immutable
/assets/*cache headers for lower TTFB (#1507). - Background polling paused on hidden tabs (#1523); collapsed chart rows unmount to stop background polling (#1580).
- shadcn/ui components migrated from Radix UI to Base UI (#2361).
See Migrate to v0.3 for upgrade steps.
chmonitor Cloud (SaaS)
dash.chmonitor.dev launched during this cycle: the same codebase runs as a hosted product with sign-in, per-user connections, and paid plans — while the self-hosted OSS build stays fully functional by default.
- Cloud mode with a public read-only demo for anonymous visitors, a welcome/setup flow, and a
/setup"Connect a host" page (#2005, #2007, #2013). - Clerk sign-in/sign-up and per-user ClickHouse connections; signed-in users see only their own hosts (#2026, #2017).
- Plans & billing via Polar: pricing page, plan limits (hosts, seats, AI budget, retention), usage summary, and org-scoped billing with seat pooling (#2018, #2029, #2039, #2019).
- One-switch deployment config:
CHM_DEPLOYMENT_MODE=oss|cloudwith centralized, single-source.env*files (#2011, #2009). - Cloud-only routes (Billing, Organization) are hidden on OSS builds (#2374, #2397).
Postgres monitoring (beta)
Postgres joins ClickHouse as a monitored source — one dashboard for both engines, with the same read-only guarantees.
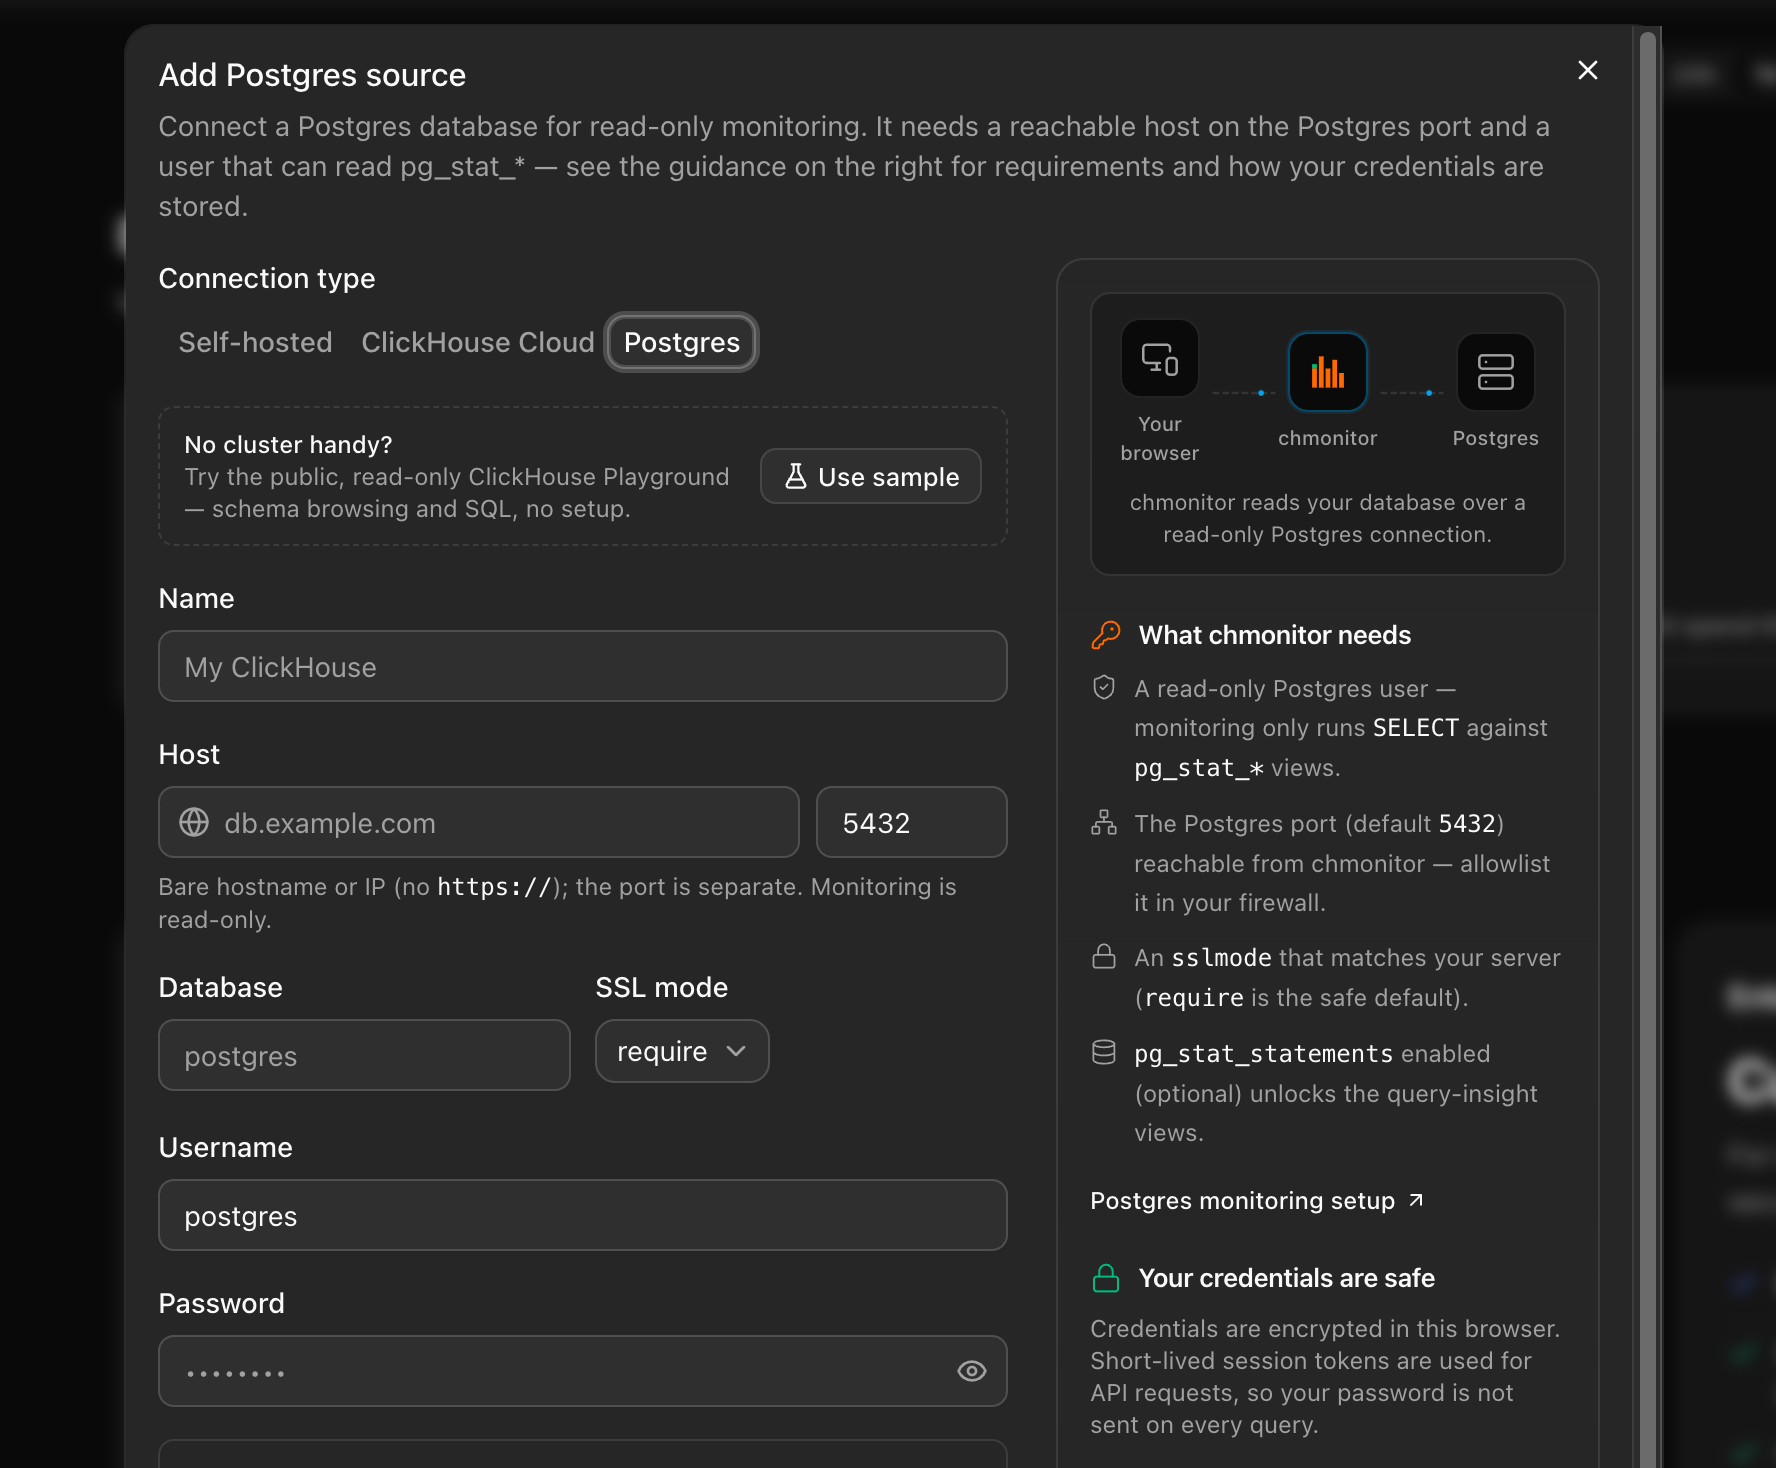
- Postgres as a monitored source: query insights from
pg_stat_statements, live activity frompg_stat_activity, and AI agent tools — behindCHM_FEATURE_POSTGRES_SOURCE(epic #2264, #2570). - Engine-aware navigation and
?pg=routing alongside?host=(#2570).
See Postgres monitoring.
PeerDB monitoring
Dedicated views for PeerDB CDC pipelines, proxied read-only through chmonitor.
- PeerDB mirrors and peer topology graph pages (#2354, #2293).
- Richer views: mirror snapshot progress, CDC batch history, fleet lag/logs feed, replication slot health (#2594).
- Per-connection PeerDB config and bearer auth (#2593).
See PeerDB.
Pluggable authentication
A new server-side auth layer replaces the previous Clerk-only approach. Set CHM_AUTH_PROVIDER to choose how requests are authenticated (#1440):
| Provider | Description |
|---|---|
none | Default. Dashboard is open — no login required. |
clerk | Clerk browser sessions — same as v0.2. |
proxy | Trust a reverse proxy: Cloudflare Access JWT or a trusted header + shared secret. |
trusted | Trust identity headers forwarded by an SSO proxy (oauth2-proxy, Authelia, Traefik forward-auth): full profile with roles/groups. |
Additional auth features:
- Read/write permission model +
CHM_CLERK_PUBLIC_READfor public read access (#1535, #1536). - Always-on API key layer (
CHM_API_KEY_SECRET) issues signedchm_Bearer tokens for scripts and MCP clients, independent of the active provider. auth=noneopens everything; the backend still enforces per-endpoint (#1533).- Auth on
/api/v1/clean,/api/v1/init,/api/v1/pageviewendpoints (#1602).
See Authentication for setup details.
Alerting & notifications
Alerting grew from a webhook health sweep into a full rules-and-routing system.
- Pluggable rule engine with built-in replication-lag / slow-query / MV-refresh rules, a custom rule builder, and compound (AND/OR) rules (#1970, #2257, #2249).
- Alert acknowledgement / manual resolution, maintenance windows, and per-rule/per-host routing (#2258, #2254, #2269).
- New channels: email (Mailgun/SendGrid), Opsgenie, PagerDuty escalation, and a native Slack app with slash commands and ACK buttons (#2218, #2248, #2281, #2275).
- Alert history persisted with a history API; remediation action links on alerts (#2231, #2255).
- Browser notifications (opt-out) and a proactive weekly HTML health report (#1858, #2253).
Cluster topology visualization
The /cluster page now shows a live topology diagram.
- Shard and replica nodes drawn with distinct shapes and the ClickHouse logo.
- Physical cluster groupings shown with labeled hull overlays.
- Nodes sized and colored by live metrics.
- Nodes can be toggled on/off; the diagram adjusts height to the data.
AI agent
The built-in AI agent runs on the Vercel AI SDK ToolLoopAgent pattern with 29+ tools covering schema, queries, diagnostics, cluster health, anomaly detection, capacity, replication, security, visualization, and more.
- Conversation titles auto-generated from the first message.
- Conversation storage — persist agent sessions to D1 (Cloudflare) or memory (#1517).
- Findings — the agent records and lists persistent findings across sessions.
- Workflow harness — dynamic workflow templates for multi-step analysis (incident-investigation, health-check, query-optimization, capacity-planning, replication-triage, migration-safety).
- BI-style SQL Console in the explorer for ad-hoc queries (#1531).
- Clickable follow-up suggestion chips; the current dashboard page is passed as context to the agent (#2331, #2561).
- New tools:
find_reference_query(retrieval over the query-config library) andlist_slow_query_patterns; expanded skill library (#2327, #2306). - Per-user external MCP server registry — register third-party MCP servers the agent can use (#2271).
- Per-message and per-conversation stats (tokens, cost, duration) and a daily AI-quota indicator (#2102, #2103).
- Multi-provider LLM config (
LLM_API_KEY,LLM_API_BASE,LLM_MODEL) plus a redesigned chat UI with model selector and more chart types in chat visualizations (#1658).
AI Insights engine
An LLM-powered insights layer that analyzes cluster state and surfaces findings — fully configurable, and clearly separated from the statistical insights.
- AI Insights panel on
/insightsplus a global header popover on every page, with persisted, auto-loaded findings (#1783, #1819). - Configurable generation: model picker, prompt style, enrichment, and live preview on the settings page (#1767, #1786).
- Pluggable insight storage backends and stable-key dismissal (#1797).
- Schema optimization suggestions and operational collectors feeding the insights board (#2343, #2296).
- Statistical anomaly baselines per cluster (cold-start safe) with configurable thresholds (#2217, #2366).
Query Insights (slow-query patterns)
A new analytics area that normalizes query_log into slow-query patterns.
- Query Insights overview with a normalized slow-query-pattern table and list/detail API (#2307, #2303).
- Pattern detail flyout with a recent-queries panel (#2316).
- Percentile selector (p50/p90/p95…) wired across duration stats and charts (#2437).
- Moving-average band and threshold anomaly overlays; memory, read-throughput, and top-users charts (#2367, #2350).
Advisor suite (recommend-only)
Read-only advisors that analyze your workload and propose changes — chmonitor never executes DDL for you.
- Query optimization advisor engine (#2234).
- Materialized-view / projection designer (#2237).
- Capacity forecast + TTL advisor (#2222).
- EXPLAIN-based query cost estimator (#2233).
Custom dashboards
- Drag-and-drop custom dashboard builder grid (#2265).
- AI-generated dashboards from a prompt (#2280).
- D1 persistence with owner-scoped read-only sharing (#2224).
MCP server
- MCP endpoint at
/api/mcp— Streamable HTTP, stateless, no separate worker required. - Clerk OAuth login/consent flow for MCP clients — authenticate with a browser OAuth flow instead of a
chm_key. - Registry manifest + one-command install for MCP clients (#2463).
- Secure by default: anonymous access denied unless
CHM_MCP_PUBLIC=true(#1830). - Bounded tool results in
list_tables/explore_table_schema(#2485).
Query page improvements
- Running queries split into a live "Running" table and a "Recently completed" table with animated row transitions.
- Slow, expensive, and failed query pages redesigned with expand panels, per-column filters, and highlighted columns.
- EXPLAIN tree — the Explain page renders the query plan as an interactive tree. Five explain modes (Plan, Pipeline, AST, Syntax, Estimate), plus a query picker and
query_idprefill (#2285). - Query detail enriched: child-query lineage, upstream tables, stack trace, per-processor stage chart, syntax-highlighted SQL (#2393, #2377).
- Request Info dialog redesigned with formatted SQL and metadata badges.
- Query favorites, bulk explain, and a global consistent time range (#1973, #1974).
- Menu counts batched into a single query per page load (#1591).
Table/card layout for all data pages
Every data table now has a card grid view alongside the standard table view. Toggle between them per page; cards default on narrow screens.
- Rolled out across all 54 query-config pages (tables, merges, replication, system, diagnostics, keeper, and more).
- Rich expandable rows for SQL, metadata, and related actions inline.
- Mobile layout uses SQL-hero cards.
New and redesigned monitoring views
- Severity-tiered Health page redesign with per-check drill-down and trend sparklines (#2346, #2359).
- Explorer Overview tab (size, engine, compression, usage per table); SQL Console with multi-query results, database picker, and tree sidebar (#2002, #1822).
- Multi-cluster fleet view, log severity filters + search, and a command palette (#1974).
- GitHub-style query-activity year heatmap on Overview; multi-disk usage breakdown (#1725, #1674).
- Redesigned Query Cache, Expensive Queries, and User Processes pages (#2283, #2276, #2288).
New views from ClickHouse system tables:
| View | System table | Route |
|---|---|---|
| Kafka consumers | system.kafka_consumers | /kafka-consumers |
| RabbitMQ consumers | system.rabbitmq_consumers | /rabbitmq-consumers |
| Async inserts | system.asynchronous_inserts | /asynchronous-inserts |
| Part log | system.part_log | redesigned with lifecycle charts, KPIs, and a filterable events table |
| Query metric log | system.query_metric_log | /query-metric-log |
| Error log | system.error_log | /errors |
| Blob storage log | system.blob_storage_log | storage economics view |
| User processes | system.user_processes | formatted badges and memory bars |
| Moves | system.moves | /moves |
| Dropped tables | system.dropped_tables | /dropped-tables |
| Warnings | system.warnings | /warnings |
| Replicated fetches | system.replicated_fetches | /replicated-fetches |
| Replicated MergeTree settings | — | /replicated-merge-tree-settings |
Connection management
- Two-column Add-host dialog with an inline docs/help panel and permission/connectivity guides (#2169, #2045).
- Connection-error classifier: failures explained with cause, fix, and a docs link (#2005).
- ClickHouse Cloud connect preset and a "Try with sample ClickHouse" preset (#2240, #2225).
- Host edit/details dialog on the host switcher, permission-gated (#2371).
See Connection errors.
Observability & integrations
- Feature-gated Prometheus
/metricsexporter (#2215). - Opt-in OpenTelemetry trace export (#2243).
- Sentry error tracking for OSS + Cloud — DSN-gated, off by default (#2040).
- Outbound webhook event bus (HMAC-signed, SSRF-guarded) and inbound
/api/events/ingest; GitHub deploy-correlation markers (#2235, #2238).
Extensibility
- Declarative query-config catalog (
CHM_CONFIG_SOURCE) — data views defined as data, not code (#1689). - Self-hosted local config override via
queries.dand a community query-pack registry (#2221, #2230). chm diagnose— zero-signup local diagnostics in the Rust CLI (#2474).
Security & rate limiting
- Fleet-wide API rate limiting (Cloudflare binding with in-memory fallback) and per-identity agent rate limits (#2559, #2131).
- Hardened SQL guards: comment-bypass fix, chart-param allowlisting, read-only validator fixes (#2484, #2482).
- Sanitized API error responses; ClickHouse errors and credentials redacted from logs (#2555, #1894).
- 503/504 (not 500) for an unreachable ClickHouse upstream (#1840).
Deployment & performance
- Helm chart — production-ready chart in
deploy/helm/, published to OCI + charts.chmonitor.dev (#1747). - Kubernetes
/healthzliveness vs/api/healthzreadiness probes (#1749). - One-click Railway / Render / Fly templates (#1708).
- Cloudflare Workers Cache enabled across workers; query-result row caps with a truncation badge (#2412, #2546).
- Health alerting — cron-based health sweep runs automatically and posts to your configured channels.
- CSV export — export any chart card's data to CSV.
- Auto-refresh interval and time range persisted to localStorage; time range synced to the URL.
Breaking changes
NEXT_PUBLIC_* → VITE_* rename (optional)
The NEXT_PUBLIC_* → VITE_* rename is optional — old names still work as a fallback. The only required action for most self-hosters is a redeploy.
See Migrate to v0.3 for upgrade steps.